
One agentic platform.
Your entire data stack.
Data engineering, analysis, and science in collaborative multiplayer workspaces for humans and agents.
Alkera works with the applications and tools you already use.
 AirflowOrchestration
 dbtTransformation
 ClickHouseAnalytics database
 DatabricksLakehouse
 DuckDBAnalytics database
- Generic SQLDatabase
 Google DocsKnowledge source
 LinearIssue tracking
 MySQLDatabase
 PostgreSQLDatabase
 SigmaBusiness intelligence
 SnowflakeData warehouse
 TableauBusiness intelligence
 AWSObject storage
 BigQueryData warehouse
 ConfluenceKnowledge source
 DatadogObservability
 FivetranData ingestion
 GitHubCode & CI/CD
 HexData analysis
 LookerBusiness intelligence
 NotionKnowledge source
 RedshiftData warehouse
 SlackCommunication
 SQLiteDatabase
 TrinoQuery engine
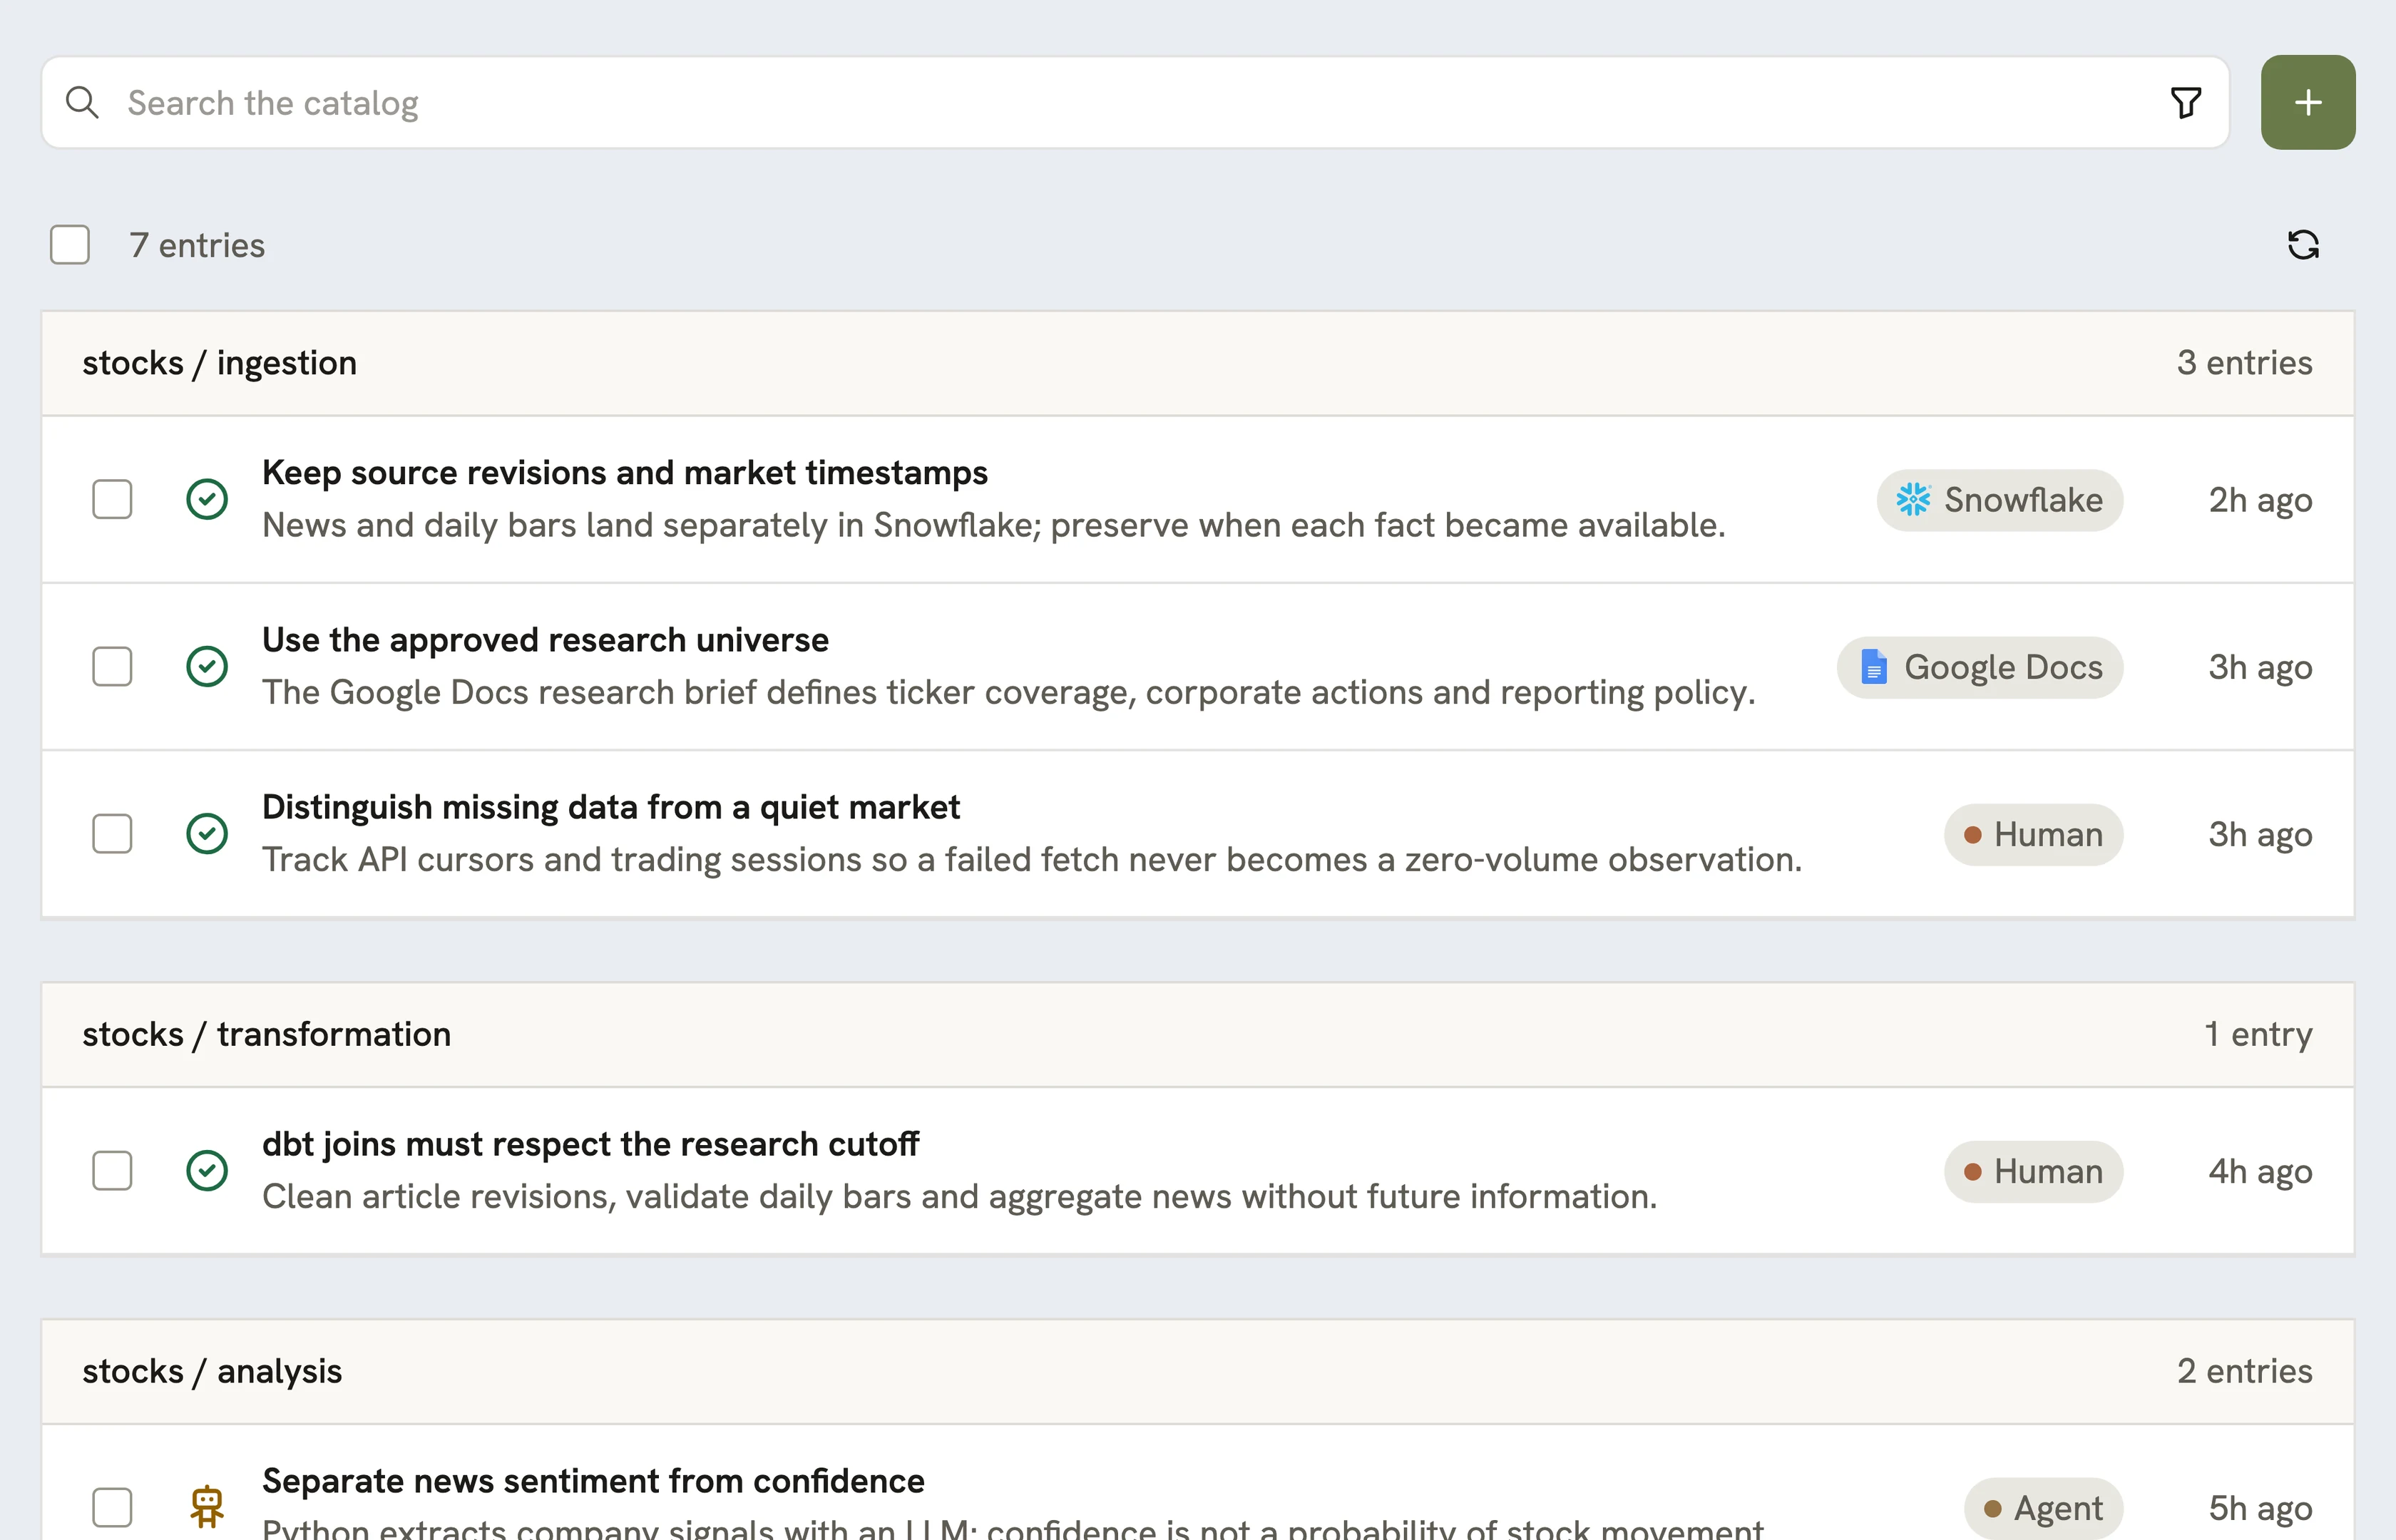
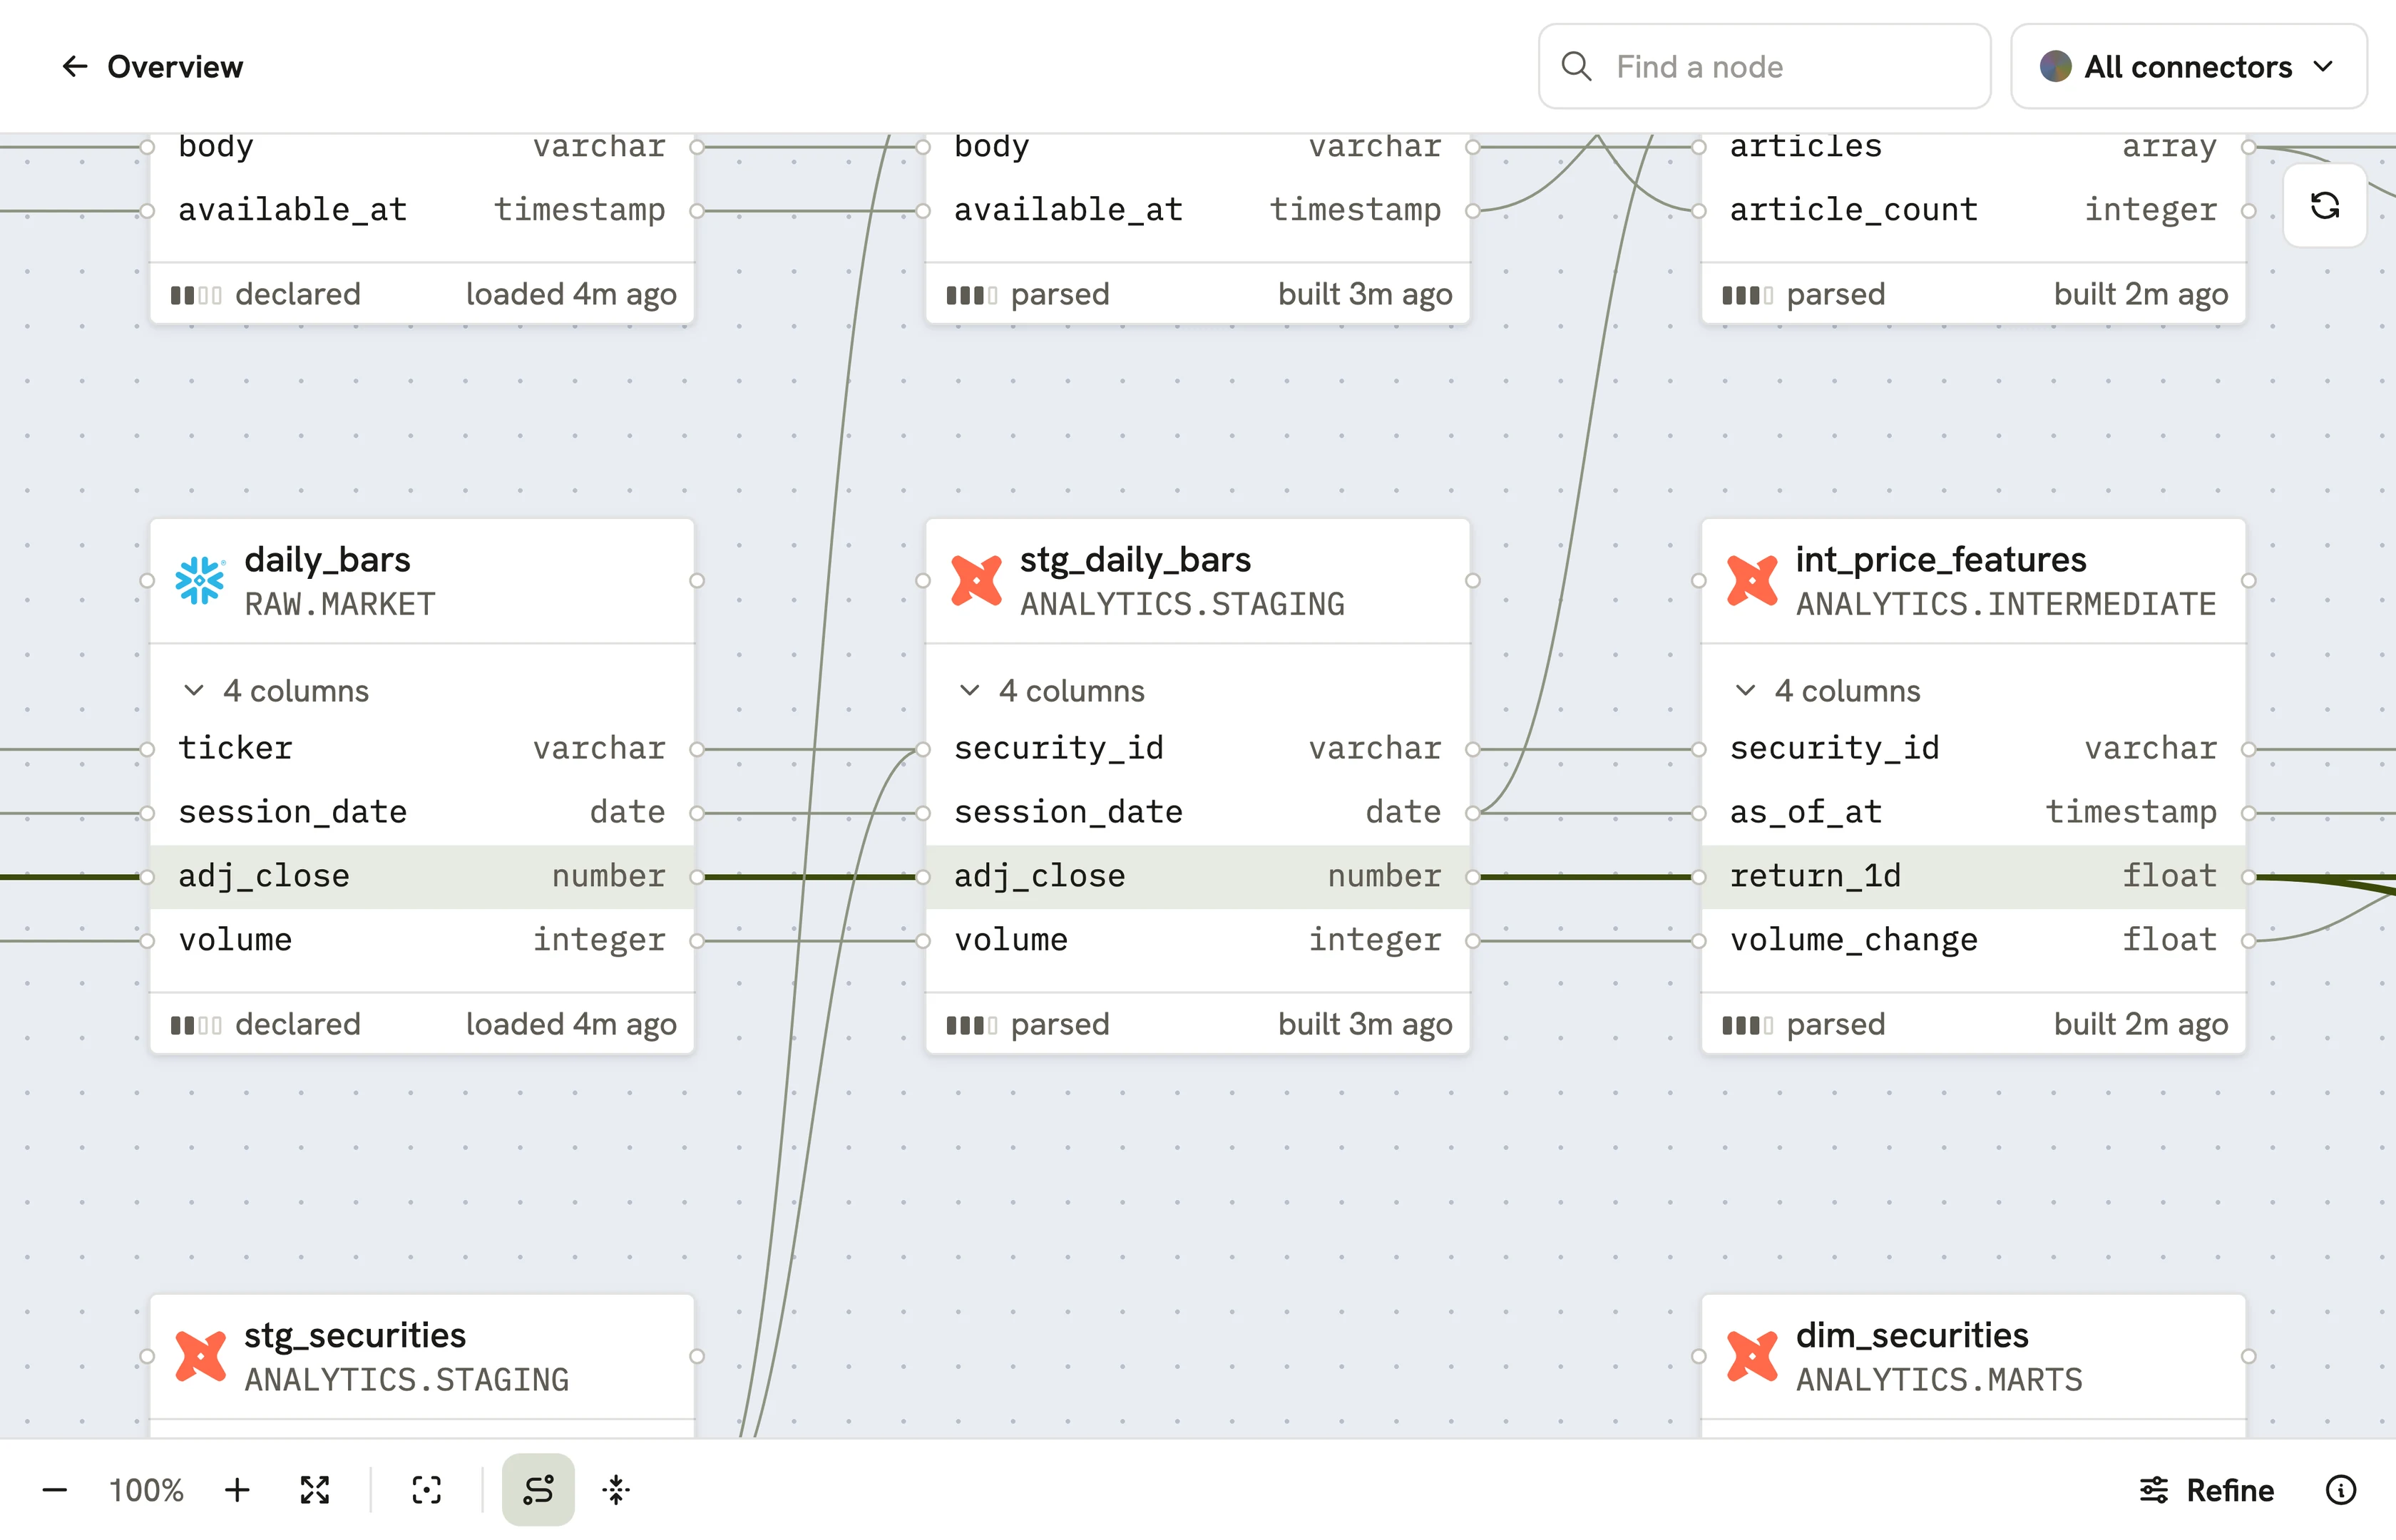
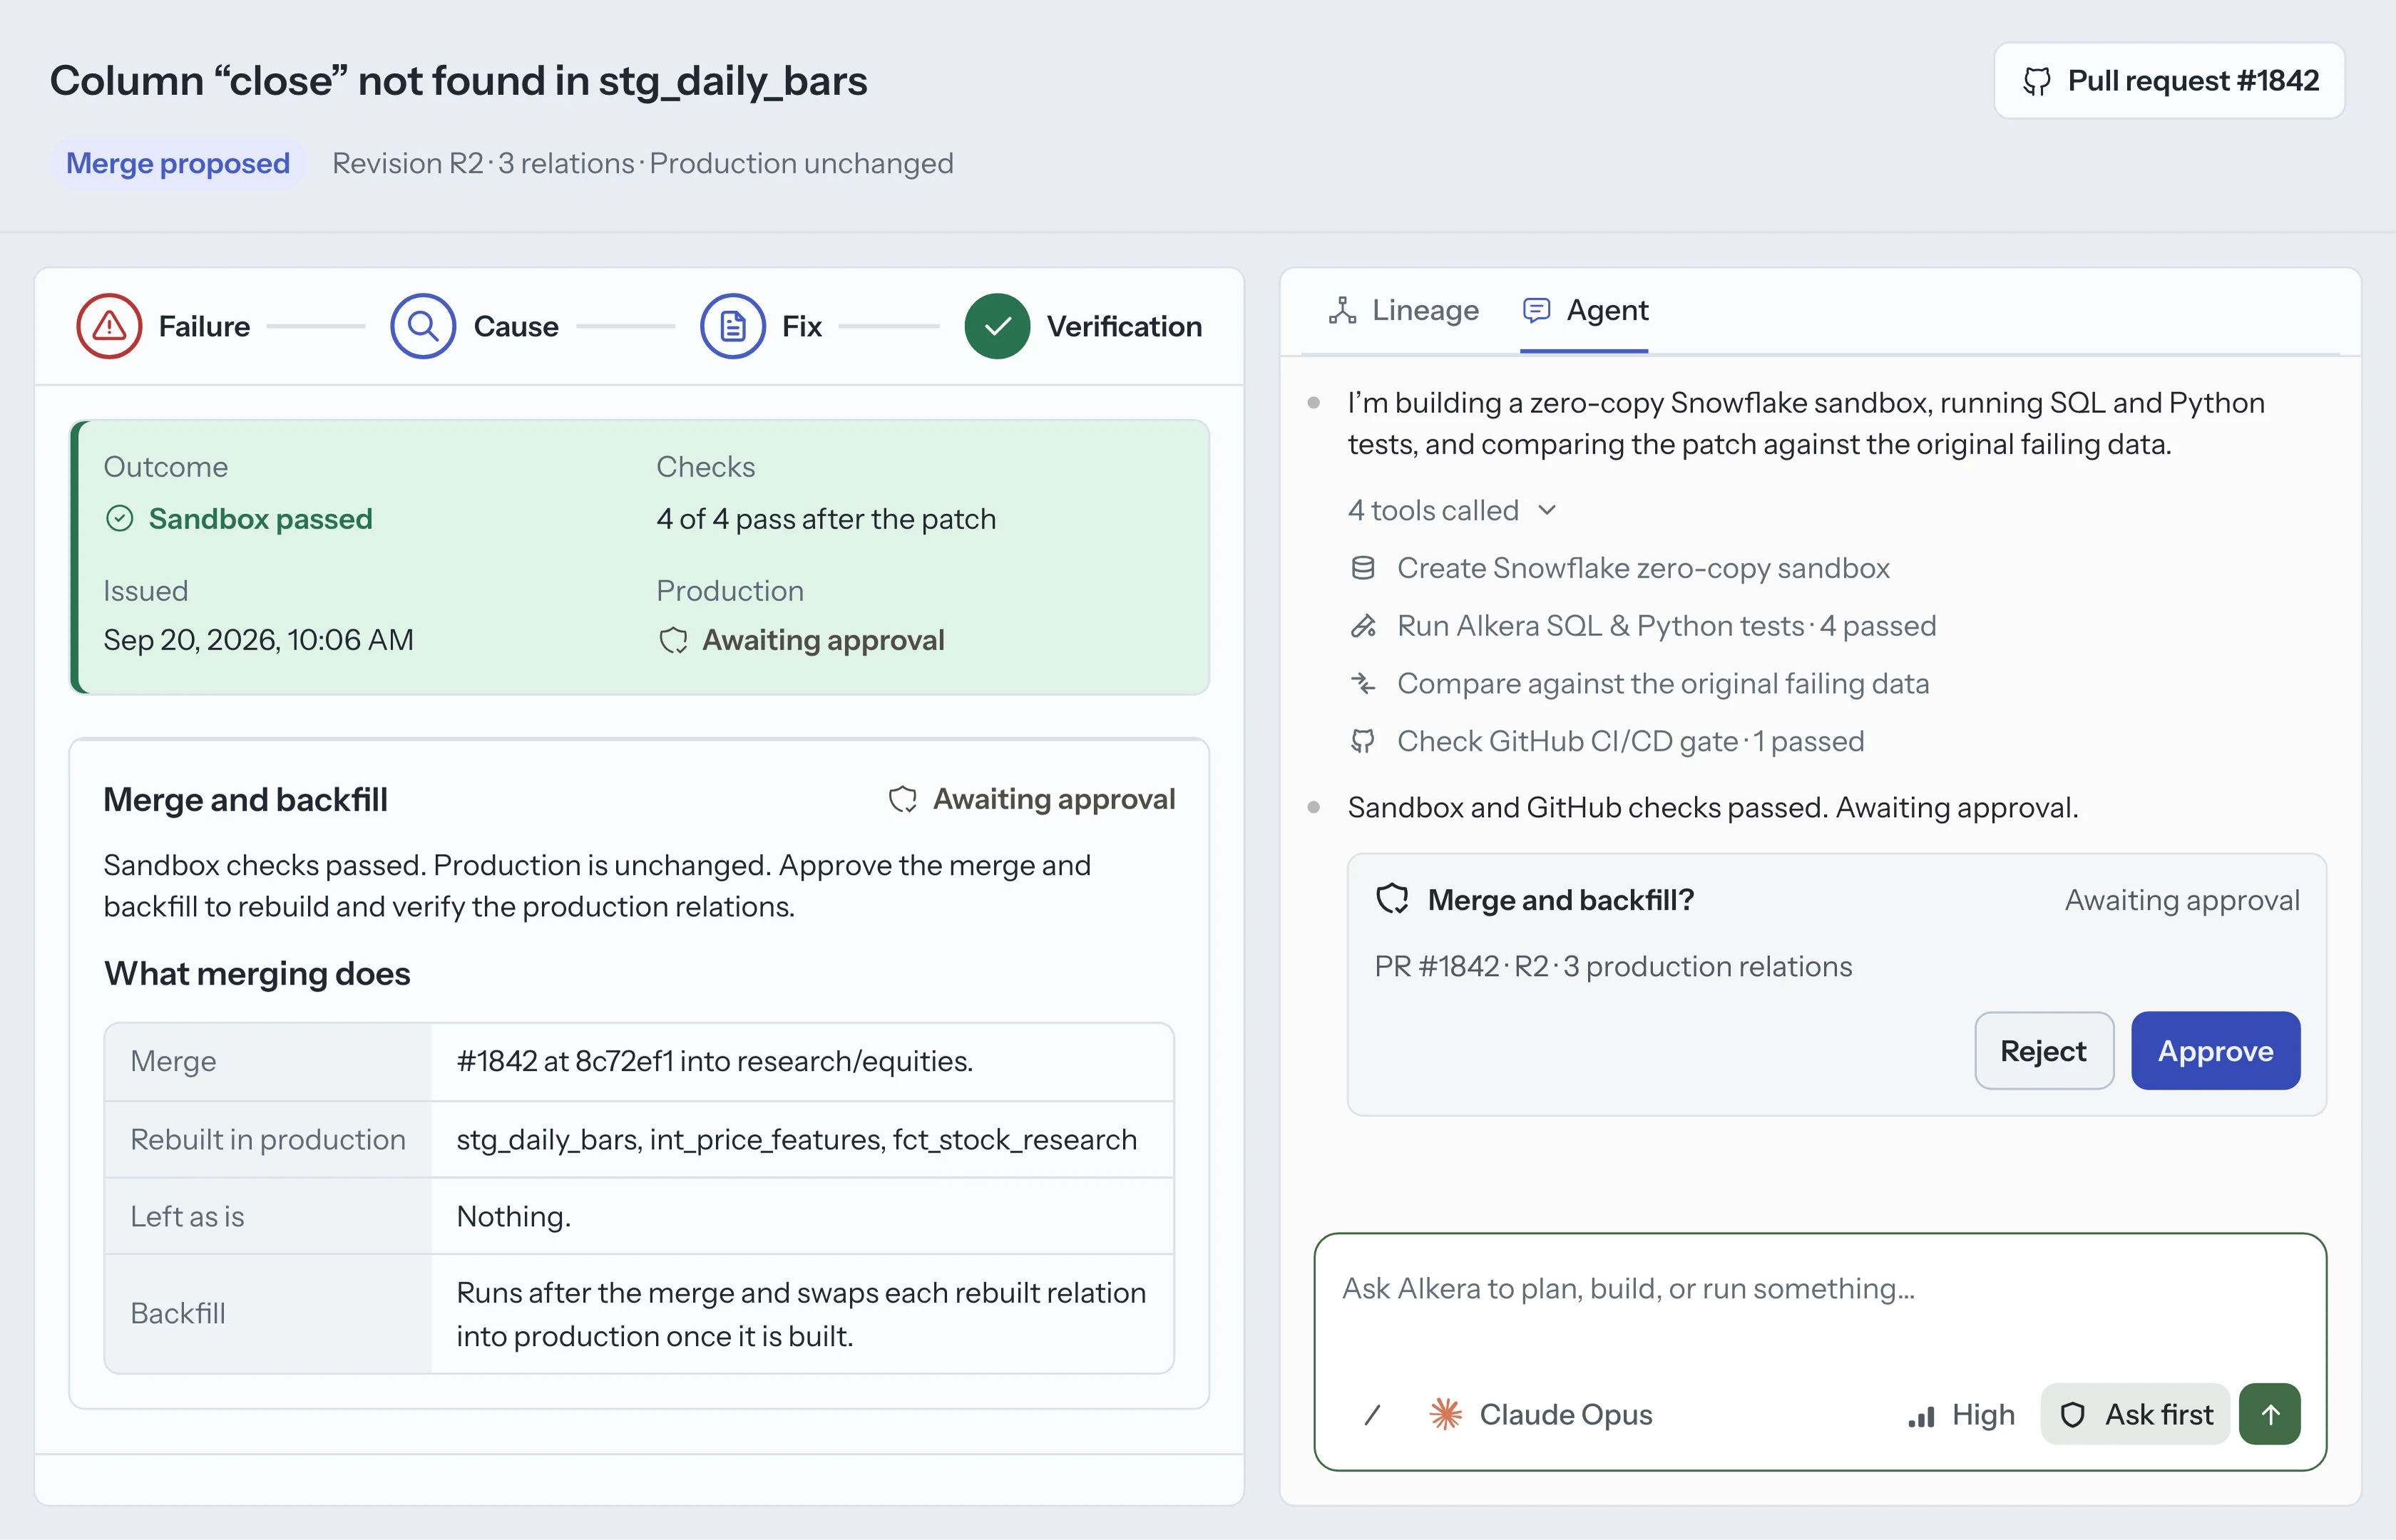
AI needs more than access to your data.
Analyze in notebooks. Share as dashboards.
Use the Alkera agent to create rich analyses in SQL and Python notebooks, then share them as interactive dashboards. Change an input and only the numbers and charts that depend on it recalculate.
Run heavy jobs
on dedicated GPUs.
Give a notebook's kernel a dedicated GPU node to train and post-train models, then chart the results in the same notebook.
8x NVIDIA B200
Work together, live.
Your team and its agents collaborate on chats and notebooks in shared workspaces. Share dashboards and other artifacts with teammates, and they update live.